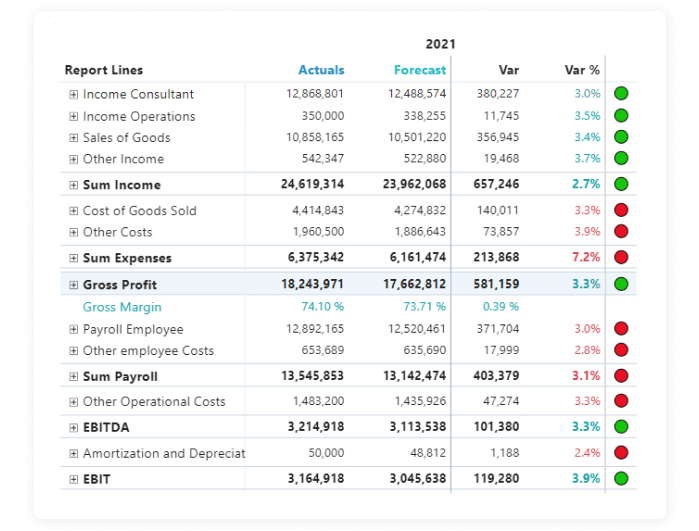
Move financial statements and P&L reports to Power BI with ease through flexible layout and formatting.
Need to build a report that looks exactly the way it does in Excel? Luckily, this is now possible.
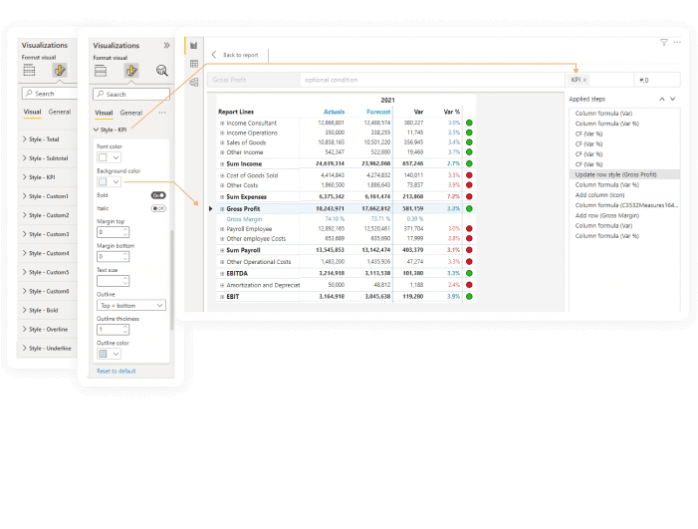
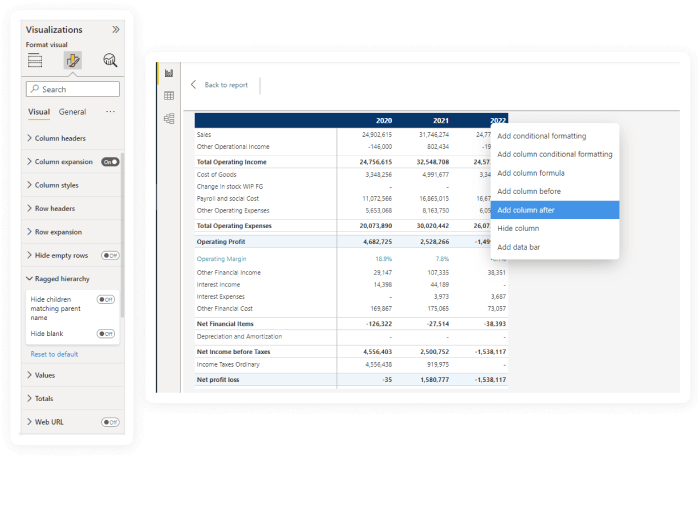
The native matrix lacks features to enable great financial statements.