What is a Gantt chart in Power BI?
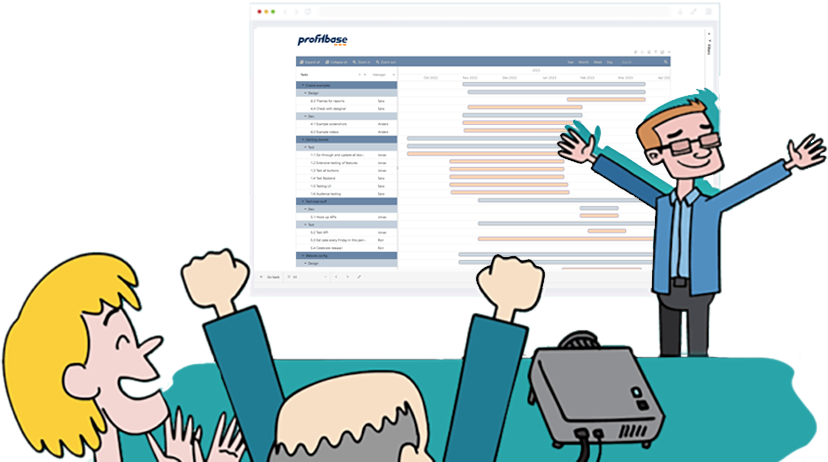
A Gantt chart is a visual project management tool that displays tasks, deadlines, and dependencies along a timeline. It allows teams to monitor schedules, track milestones, and manage workloads efficiently.
Gantt charts in Power BI provide a structured view of ongoing tasks to support real-time project tracking and resource planning. However, setting up Gantt charts in Power BI traditionally requires custom coding and formulas, making gaining the look you want more challenging.
Profitbase simplifies this process by offering a Gantt chart solution that integrates with Power BI with minimal configuration. This removes complex setup steps, allowing teams to focus on execution rather than implementation. With user-friendly features and scheduled data refreshes, Profitbase’s Power BI Gantt Chart ensures an efficient and accessible project management experience that looks precisely how you want it to.
Key Features of Power BI for Gantt Charts
Power BI enhances project tracking and resource management by integrating Gantt charts into its analytics environment. Businesses can visualise project timelines, monitor dependencies, and allocate resources efficiently—all within a centralised dashboard.
By leveraging scheduled data updates and interactive features, teams can streamline workflows and make informed decisions.
Key Features:
- Scheduled project updates – Syncs automatically with data sources up to eight times daily, ensuring timelines remain accurate.
- Customisable views – Adjust timelines, filter key project details, and modify chart layouts to fit specific business needs.
- Dependency tracking – Clearly visualises task relationships to help identify bottlenecks before they disrupt project progress.
- Drill-down capabilities – Provides deeper insights into specific tasks, milestones, and project phases for better analysis.
- Power BI integration – Embeds Gantt charts into dashboards, offering a structured project management experience.
Power BI Gantt Chart Process: How Does It Work?
Download from AppSource
Search for Profitbase in AppSource and click Add to include it in your list of Power BI visualizations.
Use as any other visual
Add data and use the format pane the same way you would with a native visual.
Using Premium features
All features are available in the free version. Purchase licenses to use premium features without the watermark.
Certified visual
The visual is certified by Microsoft, ensuring it is free from harmful code. It also allows you to export the visual to PDF or PowerPoint.
Support & Community
Want more information? Try our documentation and videos or book a demo.
Profitbase makes implementing a Gantt chart in Power BI simple and fast. Users start by connecting their project data from Excel, databases, or business applications, transforming it instantly into an interactive Gantt chart.
From there, tasks, dependencies, and milestones can be customised within a few clicks. As new data is added, the chart updates automatically, providing insights into project progress. This removes the need for manual updates or complex calculations, allowing teams to track performance effortlessly.
The Profitbase Gantt chart seamlessly integrates into Power BI, ensuring that all stakeholders have clear, data-driven insights at all times.
Key Benefits:
- Single, interactive dashboard – Consolidates all project data for a clear, real-time overview, reducing the need for multiple tools.
- Automated data updates – Eliminates manual updates, ensuring that project information remains accurate and up to date.
- Live reporting – Provides instant insights into project progress, allowing teams to adjust plans proactively.
- Seamless collaboration – Enables cross-department access to insights, improving alignment between teams and stakeholders.
- Scalability – Adapts to projects of any size, from small teams to enterprise-wide operations.
- Strategic oversight – Offers a long-term view of project performance, supporting better planning and execution.
Profitbase enhances these capabilities by integrating an interactive Gantt chart solution within Power BI. This ensures businesses have a flexible and user-friendly tool for project tracking and planning.
Benefits of Using Power BI
Power BI transforms project management by providing a centralised, data-driven approach to tracking tasks, deadlines, and resource allocation. Its ability to automate scheduled updates and integrate insights ensures businesses can make informed decisions quickly, improving efficiency at every level.
Why use Profitbase’s Power BI Gantt Chart Solution?
Stay on top of your plans
Profitbase is designed for business leaders, not just data analysts. CFOs and executives can quickly build clear, data-driven project timelines without technical expertise. With fast deployment and intuitive configuration, teams can focus on execution rather than setup.
Profitbase’s integration with Power BI ensures that Gantt charts become an integral part of a company’s broader analytics strategy, aligning project management with overall business goals.
Take your Power BI project tracking to the next level with Profitbase’s interactive Gantt chart solution—request a demo today to see how it simplifies project planning and execution.
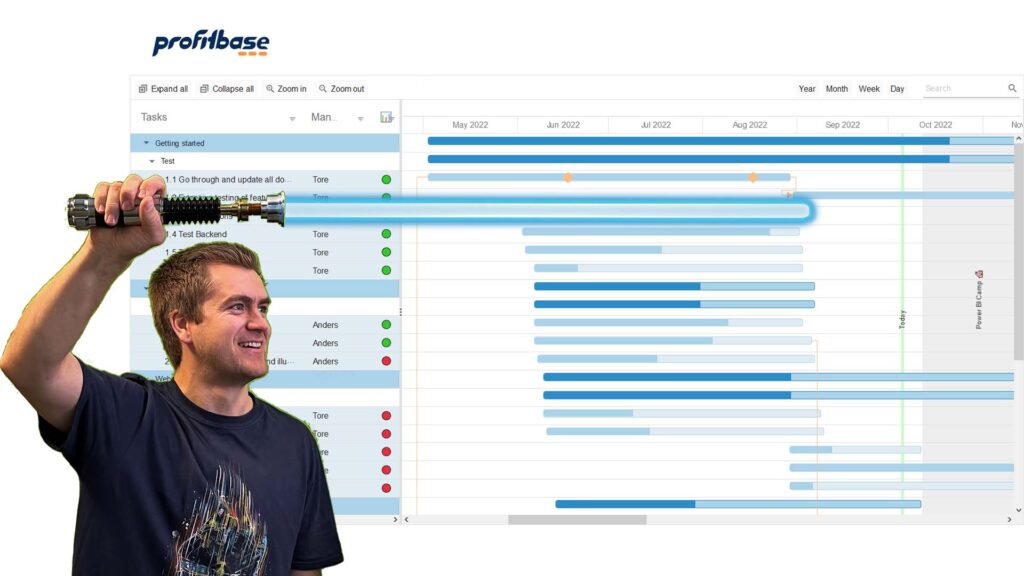
- Multiple levels of hierarchy
- Show additional columns as required
- Powerful search function, quickly find the task you’re looking for
- Supports multiple milestones for each task
- Lots of formatting options
What Sets Profitbase’s Power BI Gantt Chart Apart?
Here’s how Profitbase’s Power BI Gantt Chart solution stands out from competitors:
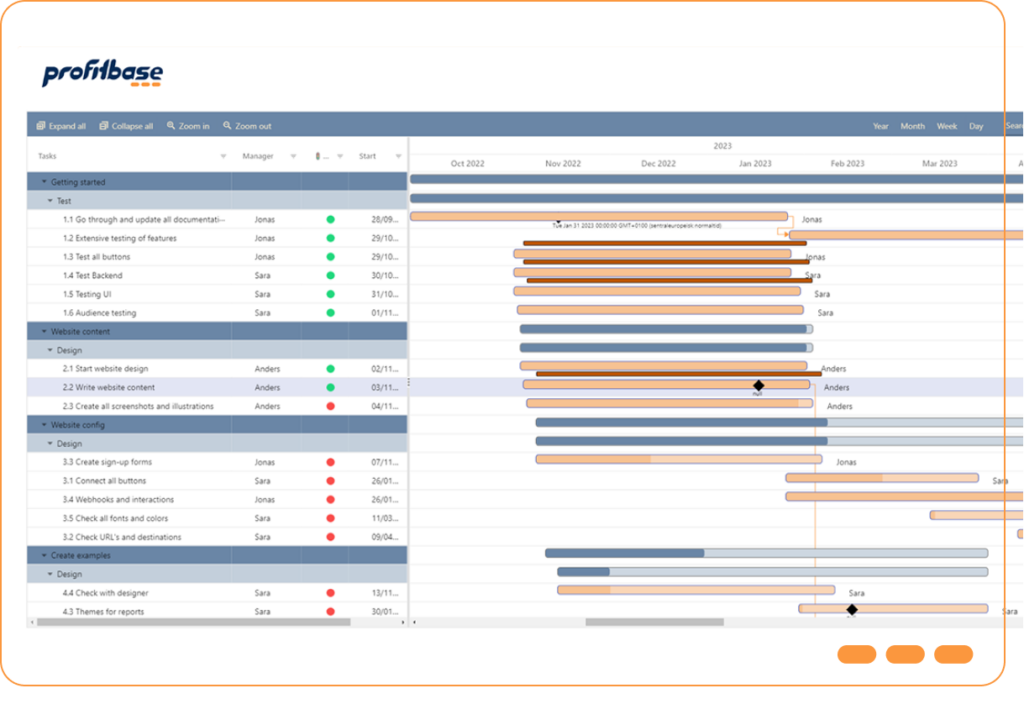
- Simple Customisation – Create, modify, and tailor Gantt charts effortlessly to fit your project needs.
- Advanced Formatting: You can Recreate the look and feel of other systems, such as PDFs or CSVs, but now you can use them directly in Power BI.
- Enhanced Project Visibility – Track dependencies, milestones, and resource allocation in a structured, easy-to-read format.
- Data-Driven Decision-Making – Leverage real-time insights to adjust project plans and optimise efficiency.
Unlike generic Gantt chart tools, Profitbase delivers an enterprise-grade solution designed for scalability, automation, and intelligent timeline forecasting. With a focus on data accuracy and scheduled performance tracking, businesses gain a more transparent, actionable view of project workflows.